
 Lesson
Analysing Your Social Media
& Social MediaAn intro to analysing your social media insights and activity.
ANALYSING YOUR SOCIALS
What is metadata?
Meta data is data about other data. 2023 is the first year where data has become more valuable than oil and no doubt one day will surpass gold prices. The sooner you can be building data about your business and using it to target your audience, the quicker you will see growth.
What is metadata?
Meta data is data about other data. 2023 is the first year where data has become more valuable than oil and no doubt one day will surpass gold prices. The sooner you can be building data about your business and using it to target your audience, the quicker you will see growth.
What is meta suite?
Meta suite is a tool not only to assist you with using Instagram & Facebook but also to view all your analytics in one spot. Meta suite is easy to use and available on all Facebook business accounts. Simply by creating your business account you can see the meta suite option listed down the left hand side of your screen. You can manage your Instagram and Facebook accounts all from the one suite. Meta business suite lets you manage all of your business pages from your personal one rather than swapping profiles.
Followers vs Likes
When someone 'likes' a page, they're showing support for the page and that they want to see content from it.
The page will show up as being liked in the 'about' section of that person's profile. This means it shapes a persons profile. If you've ever looked at another persons profile you may see on there that it is available for you and others to know they "like" certain things. However, when someone 'follows' a page, it means they may just receive updates about the page in their feed. With a 'follow', you will only receive page updates and posts in your feed from that brand's page. Others don't necessarily know you follow this page. Page 'likes' will also determine the types of Facebook ads you are shown. A like is an automatic follow, but the opposite is not true. You can follow a page without liking it. You can also like a page and unfollow it, which means you will stop receiving their updates and content in your feed. The brand will still show up as a like in your about section and they can still see your name and profile picture. Your follower total is a stronger indicator of the number of people who would like to see your content in their feeds, which is why tracking the follower numbers is a better indicator of people who are interested in seeing your posts. In short, 'liking' a Facebook page is a public display of support, while 'following' a Facebook page indicates interest in receiving content.
To Summarise:
Follower
Receive updates about the page in your feed.
Others can't see you follow the page.
You don't have to like the page.
Followers want to actively see your content.
Like
A public display of support for the page.
Automatic follow (see content) but you can unfollow if you choose.
Displayed in your 'About' section - others can see you liked the page.
Determines the types of ads you see.
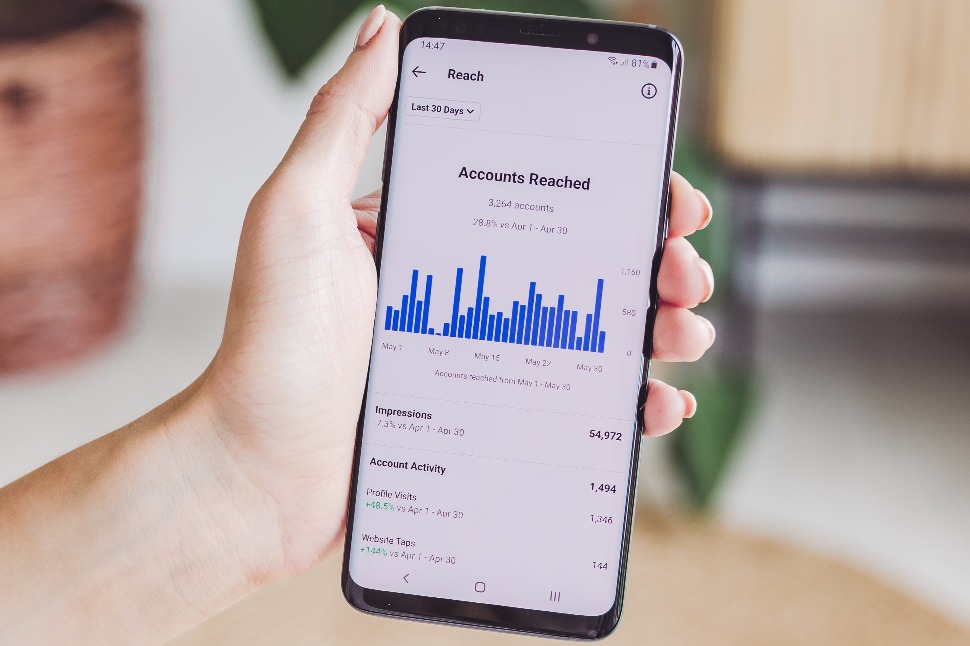
Impression vs Reach
A public display of support for the page.
Automatic follow (see content) but you can unfollow if you choose.
Displayed in your 'About' section - others can see you liked the page.
Determines the types of ads you see.
Impression vs Reach
Impressions are the number of times any content from your page or information about your page entered a person's screen.
Are impressions good on Facebook?
A high number of impressions indicate that your ad is boosted on the platform and to your audience.
Reach is the total number of people who see your content. Impressions are the number of times your content is displayed, no matter if it was clicked or not. Think of reach as the number of unique people who see your content. In a perfect world, every one of your followers would see every piece of content you post.
Impressions are important because they help a marketer understand their potential for reaching more people with their messaging.
Views, though, are critical to marketers because they provide insight into the level of engagement a person has with their content (i.e. the reach to their audience).
To Summarise:
Impression
Amount of times your content enters a person's screen.
Potential reach - possible range the post can go
Potential reach - possible range the post can go
Reach
Total number of people who see/read your content.
Realistic reach - level of engagement of the post
Social media metrics
Total number of people who see/read your content.
Realistic reach - level of engagement of the post
Social media metrics
The most important social media metrics.
- Reach.
- Impressions.
- Audience growth rate.
- Engagement Rate. What is engagement rate? Engagement rate is a social media marketing metric that measures the amount of interaction a piece of content (or a campaign, or a whole account) gets compared to reach, followers or audience size.
- Amplification rate. Amplification Rate is the ratio of shares per post to the number of overall followers. For example, “the rate at which your followers take your content and share it through their networks.”
- Virality rate. The virality rate measures how your content is spreading exponentially. To calculate virality rate, divide a post's number of shares by its impressions. Multiply by 100 to get your virality rate as a percentage.
- Video views. Your video views are important as this indicates how many people are watching.
- Video completion rate. Your completion rate is just as important as your video views. It's important to understand if they are watching the whole video or only starting to watch, as you might need to tweak your content or length of video.
Types of analysis
- Descriptive Analysis - is the process of using current and historical data to identify trends and relationships. It's sometimes called the simplest form of data analysis because it describes trends and relationships but doesn't dig deeper.
- Diagnostic Analysis - is a form of advanced analytics that examines data or content to answer the question, “Why did it happen?” It is characterised by techniques such as drill-down, data discovery, data mining and correlations.
- Predictive Analysis - is a branch of advanced analytics that makes predictions about future outcomes using historical data combined with statistical modelling, data mining techniques and machine learning. Companies use predictive analytics to find patterns in this data to identify risks and opportunities.
- Prescriptive Analysis - is a form of advanced analytics which examines data or content to answer the question “What should be done?” or “What can we do to make _______ happen?”, and is characterised by techniques such as graph analysis, simulation, complex event processing, neural networks, recommendation engines.
Resources


Become a subscriber today and level up your business skills!
- Access to our ever-growing library of skills and training material
- Build your digital skills and confidence online
- Highlight your business by featuring in our directory